Monthly Market Insight, October 2024
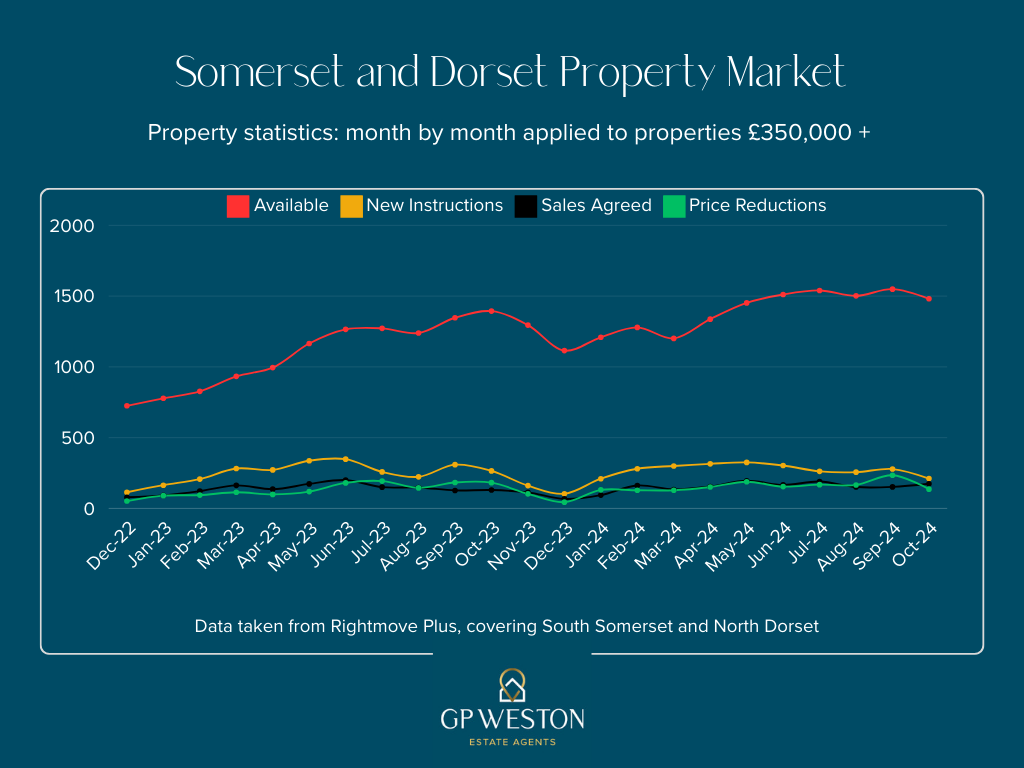
Every month we chart the number of available properties, the number of new instructions, the number of sales agreed and the number of price reductions in our local area.
We use this data to work out how the numbers could: –
- Affect someone’s decision to put their property on the market.
- Affect how prices could move.
- Determine the length of time it may take to sell.
- Influence whether to price conservatively or ambitiously.
We compare the local market to the national one and use articles from different sources to put meat on the bones.

AVAILABLE PROPERTIES: Over the last 23 months the numbers of properties on the market have been steadily increasing. Dec ‘22 had 725 properties available and by Oct ‘24 that had increased to 1481, almost double. This has two effects, the first is that prices will fall, or certainly not increase, and secondly it will take longer to sell as buyers have more choice.
NEW INSTRUCTIONS: 2024 has been unusual in the consistency with which properties have been coming to the market. Normally there are quiet months in Jan, Feb, Jul, Aug, Nov and Dec. as seen in 2023. Whilst we have not seen the summer dip, I do note the drop in new instructions in Oct ‘24 and expect them to be even fewer in the last two months of the year.
SALES AGREED: These have remained consistent with the usual seasonal dips in August and December in 2023, surprisingly in 2024 we didn’t see the dip in August. This could coincide with interest rates beginning to fall, bringing a little optimism back to the market after 2 tough years.
PRICE REDUCTIONS: The number of price reductions over this period appears fairly stable. Increasing slightly in numbers before the quieter months of August and December as people become increasingly motivated to agree a sale ahead of these quieter periods.
The “new normal” a phrase coined after the financial crisis in 2007/8 when we saw annual property transactions drop from 1.4m in 2006 and 1.35m in 2007 down to 750,000 in 2008 nationwide.
The volume of transactions didn’t improve until 2014 resulting in 1.05m sales. The numbers stayed at this level until 2020, when Covid struck, but so swift was the reaction to lock-down that even though the first half of 2020 saw only 348,690 transactions the year still finished with a total of 888,290 sales!
Transactions increased to 1.26m in 2021 and decreased slightly in 2022 to 1.068m. It is therefore easy to understand how after 2 years of pre 2008 transaction levels, some homeowners are wondering why their properties aren’t selling.
With the data used in the above graph, I divided the number of sales agreed each month, by the available number of properties and multiplied by 100 resulting in the % of properties being sold. In 2024 it ranges from 8% to 13%. i.e. only 1 in 10 homes are going under offer. In 2023 that range was 6% to 17%.
Total sales agreed year to date in 2024 are 1573 whilst for the same 10 months in 2023 it was 1441, a smaller number but there were also fewer properties on the market so a greater proportion were being sold.
Everything we have talked about so far has been about the raw numbers; we haven’t mentioned what has been happening to house prices. Every month Rightmove, Halifax et al. talk about rising house prices, but the devil is in the detail. Rightmove quote “asking prices,” these are not the sold prices but a measure of both homeowners’ sentiment and the estate agents’ desperation to win the instruction by over-valuing.
There are no “local area” indices, but I receive updates from various sources and the following hit my inbox earlier today from Zoopla:
“Property prices in South Somerset fell slightly by 0.8% over the past year, cutting £2,300 from the price of the typical home, according to our September 2024 House Price Index.
The fall is not reflected across the UK, where the average property price rose by 1% since September 2023. The typical South Somerset home is now worth £283,300, above the UK average house price of £267,500.
Over the past month, prices in South Somerset have grown slightly. And looking back over the last five years, the average property value has grown by 22.3%”
This certainly reflects what we have been seeing. A very mild softening of prices, properties remaining on the market for a long time due to overpricing, something some agents should be held accountable for as few are prepared to value realistically for fear of losing the instruction.
I hope the above has been of some interest to you and if you would like to see the source data, talk about how the market might affect your move or when might be the best time to sell, I would be delighted to talk to you. I enjoy nothing more than discussing the stats and figures, after all, it is all about the stats and figures when it comes to property!
Yours James Weston.