Monthly Market Insight, November 2024

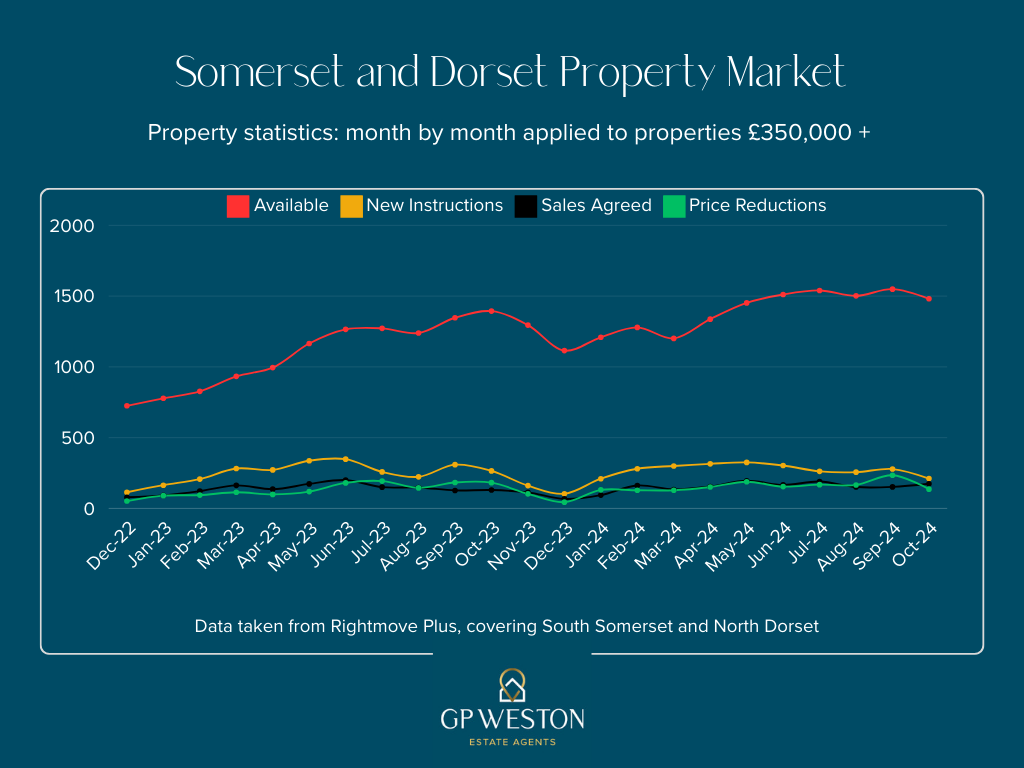
Every month we chart how the number of available properties, the number of new instructions, the number of sales agreed and the number of price reductions in our local area.

We use this data to work our how the numbers could:-

  • Affect someone’s decision to put their property on the market.
  • Affect how prices could move.
  • Determine the length of time it may take to sell.
  • Influence whether to price conservatively or ambitiously.

We compare the local market to the national one and use articles from different sources to put meat on the bones.
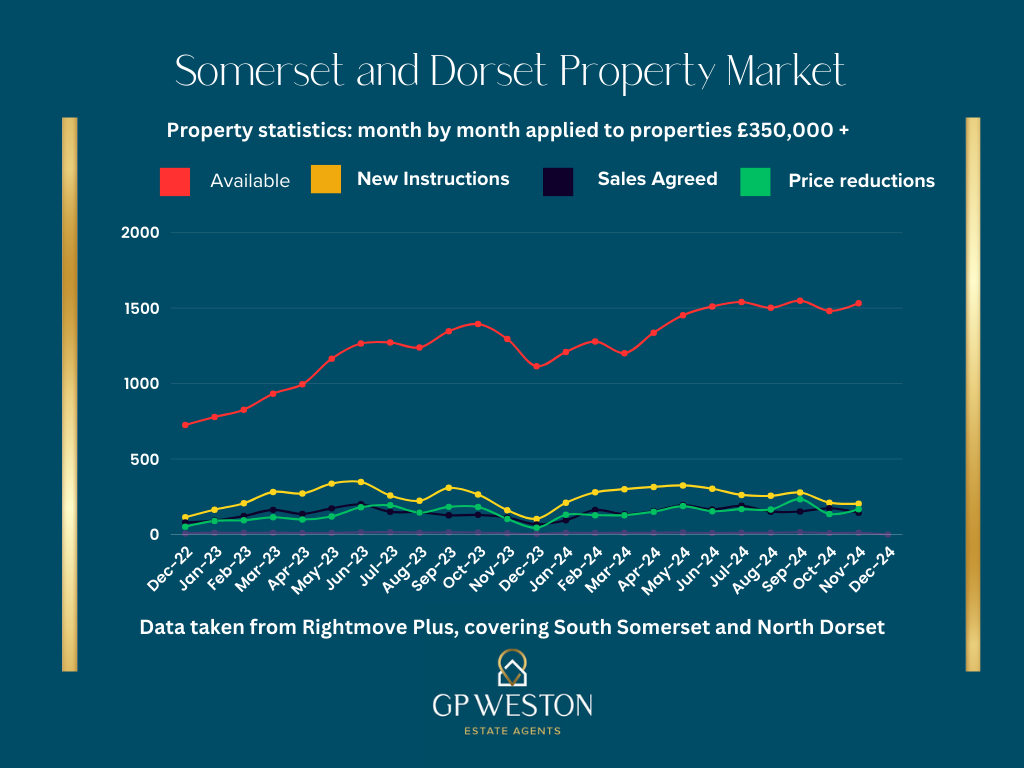
AVAILABLE PROPERTIES: Last month I commented on how the number of available properties had almost doubled over the last 2 years. By the end of November the number increased by another 50 taking the number of available properties over double (1532 compared to 725). This continues to push prices down gently and also means that properties are remaining on market longer as buyers have more properties to choice from.

NEW INSTRUCTIONS: 2024 has been unusual in the consistency with which properties have been coming to the market. Traditionally the quieter months are Jan, Feb, Jul, Aug, Nov and Dec. as seen in 2023. Whilst we have not seen a ‘summer dip’, there was a decrease in October and this has continued into November. However with stamp duty increasing in April 2025 sellers may be rushing market their properties ahead of the changes, pushing the number of available properties higher than they might otherwise be.

SALES AGREED: Remained fairly consistent with the usual seasonal dips in August and December in 2023, surprisingly in 2024 we didn’t see the dip in August. This could coincide with interest rates beginning to fall, bringing a little optimism back to the market after 2 tough years. We are seeing numbers of transactions drop off as we near the end of the year but perhaps not as much as they might otherwise be due to a rush to beat the increase in stamp duty in April 2025.

PRICE REDUCTIONS: The number of price reductions increased markedly in November as agents push sellers to reduce in the hope of agreeing a sale agreed before the end of the year. Whilst this can sometimes pay off, Sales that do not exchange before Christmas can often “fall through” as buyers change their minds due to having too much time to think. There is a saying “time kills deals”. A good agent drives the conveyancing process to complete before something happens to derail it.

In my last market comment I wrote about how transaction levels had changed over the last 15 or so years. This month I decided to download the Land Registry data for the “South West”. As I looked at the numbers there were some noticeable shifts coinciding with global events. The graph below demonstrates the average number of monthly transactions in the South West and how they were impacted by global events.

In conclusion, the property market changed significantly and permanently after the financial crisis. Transaction levels dropped by 40% due to caution in lending from the banks and their more stringent stress testing of a borrower’s financial capability. Transaction levels did improve as time went by but was never more than about 80% of the pre-financial crises average.

More recently we had the post-Covid boom where the population re-imagined how they were living and how the home was used. The shift to remote working meant people needed an office, either in the house or in the garden and so there was a significant amount of up-sizing or relocation to cheaper areas.

Now we arrive at the current state of affairs! After the boom of the last two years a lull in activity was inevitable as buyers had brought their move forward. The post 2022 budget sent interest rates up to 5%+ resulting in transaction levels being lower now than even during the post financial crisis. This is evidenced by the number of available properties doubling whilst the sales agreed stays the same.

The era of cheap money is over, certainly for the foreseeable future. Wages are now increasing faster than inflation and house prices have stalled, meaning affordability remains OK for most. However there have been many people in the past couple of years (and an equal number over the next couple of years) who have come off sub 2% mortgage deals and on to 4%, 5% and in some cases even higher mortgage rates. It is testament to the post financial crisis stress testing that there have not been more forced sales but buyers purchasing power has been severely curtailed as monthly payments are significantly higher than they have been for the period between 2008/9 and 2022.

As always there are mixed signals for the market ahead, the members of the Institute of Directors were recently canvassed and their confidence levels for the economy going forward is lower than during the years after the financial crisis. Inflation is currently higher than the target at 2.7% meaning interest rate cuts are likely to be smaller than we had hoped for earlier in the year. The added N.I. costs mean that unemployment might increase a little and wage increases stall.

In 2024 the South West under performed compared to the rest of the country with prices sliding downwards gently compared to the national market with slightly higher average prices. There is a lack of confidence among businesses surveyed by the IOD, the budget has caused inflationary pressures and will likely keep interest rates from being cut as much as they might have been. I think unemployment might rise slightly and wages stagnate a little. But on the positive side, history shows us that people can only put their lives on hold for so long and after 2-3 years the market kicks on again as buyers return to the market having decided they can’t wait any longer.

Many agents have revised their 2025 predictions slightly from a 5% increase to a 4.5% nationally. If the South West performs as it has done in 2024 (i.e. 2.0%-3.0% below the national average) that would see a 1%-2% rise in 2025.

SUMMARY: There are a lot of properties that have been sitting on the market for months and months, some with some significant price reductions of 30% or more and others with no price reductions. In my experience if a property doesn’t sell within 3-4 months it is because it is too expensive in the current market. We don’t see prices increasing more than a percent or two next year and therefore sitting it out is not going to achieve anything and the property will just go stale. If you are currently on the market and not receiving any interest our advice is to couple a price reduction with a switch to a new agent. If you are thinking of coming to the market then consider pricing your property at the lower end of appraisals you receive because that is likely to be the most realistic.

I hope the above has been of interest to you and if you would like to see the source data, discuss how the market might affect your move or when might be the best time sell, I would be delighted to talk to you. I enjoy nothing more than analysing the stats and figures with people. It is all about stats and figures when it comes to property!

Monthly Market Insight, October 2024

Every month we chart the number of available properties, the number of new instructions, the number of sales agreed and the number of price reductions in our local area.

We use this data to work out how the numbers could: –

  • Affect someone’s decision to put their property on the market.
  • Affect how prices could move.
  • Determine the length of time it may take to sell.
  • Influence whether to price conservatively or ambitiously.

We compare the local market to the national one and use articles from different sources to put meat on the bones.

AVAILABLE PROPERTIES: Over the last 23 months the numbers of properties on the market have been steadily increasing. Dec ‘22 had 725 properties available and by Oct ‘24 that had increased to 1481, almost double. This has two effects, the first is that prices will fall, or certainly not increase, and secondly it will take longer to sell as buyers have more choice.

NEW INSTRUCTIONS: 2024 has been unusual in the consistency with which properties have been coming to the market. Normally there are quiet months in Jan, Feb, Jul, Aug, Nov and Dec. as seen in 2023. Whilst we have not seen the summer dip, I do note the drop in new instructions in Oct ‘24 and expect them to be even fewer in the last two months of the year.

SALES AGREED: These have remained consistent with the usual seasonal dips in August and December in 2023, surprisingly in 2024 we didn’t see the dip in August. This could coincide with interest rates beginning to fall, bringing a little optimism back to the market after 2 tough years.

PRICE REDUCTIONS: The number of price reductions over this period appears fairly stable. Increasing slightly in numbers before the quieter months of August and December as people become increasingly motivated to agree a sale ahead of these quieter periods.

The “new normal” a phrase coined after the financial crisis in 2007/8 when we saw annual property transactions drop from 1.4m in 2006 and 1.35m in 2007 down to 750,000 in 2008 nationwide.

The volume of transactions didn’t improve until 2014 resulting in 1.05m sales. The numbers stayed at this level until 2020, when Covid struck, but so swift was the reaction to lock-down that even though the first half of 2020 saw only 348,690 transactions the year still finished with a total of 888,290 sales!

Transactions increased to 1.26m in 2021 and decreased slightly in 2022 to 1.068m. It is therefore easy to understand how after 2 years of pre 2008 transaction levels, some homeowners are wondering why their properties aren’t selling.

With the data used in the above graph, I divided the number of sales agreed each month, by the available number of properties and multiplied by 100 resulting in the % of properties being sold. In 2024 it ranges from 8% to 13%. i.e. only 1 in 10 homes are going under offer. In 2023 that range was 6% to 17%.

Total sales agreed year to date in 2024 are 1573 whilst for the same 10 months in 2023 it was 1441, a smaller number but there were also fewer properties on the market so a greater proportion were being sold.

Everything we have talked about so far has been about the raw numbers; we haven’t mentioned what has been happening to house prices. Every month Rightmove, Halifax et al. talk about rising house prices, but the devil is in the detail. Rightmove quote “asking prices,” these are not the sold prices but a measure of both homeowners’ sentiment and the estate agents’ desperation to win the instruction by over-valuing.

There are no “local area” indices, but I receive updates from various sources and the following hit my inbox earlier today from Zoopla:

This certainly reflects what we have been seeing. A very mild softening of prices, properties remaining on the market for a long time due to overpricing, something some agents should be held accountable for as few are prepared to value realistically for fear of losing the instruction.

I hope the above has been of some interest to you and if you would like to see the source data, talk about how the market might affect your move or when might be the best time to sell, I would be delighted to talk to you. I enjoy nothing more than discussing the stats and figures, after all, it is all about the stats and figures when it comes to property!

Sherborne Times Article

Property Article

I think everyone likes to think they have something to say, hopefully something interesting. For the past 12 years, as I have managed various offices or been self-employed, I am often asked my opinion on the housing market, and whilst I am no economist, I do like stats and data. I also can’t stand the sensationalist headlines that the press throws out to sell the odd rag or two. I therefore try to give a calm and measured opinion on the market, drawing from my experience of working through the financial market crash of 2008-2009, through the Brexit vote and subsequent loss of confidence, through Covid, and now in the era of higher interest rates. I am therefore very pleased to say that I will be writing a bi-monthly article for the Sherborne Times, covering the market as a whole but also things of interest to home movers, would-be home buyers and anyone else with an interest in property.

Our Favourite Places to Eat

Here at GP Weston we really want to create a hub of information relevant to people living in the area we call home. With that in mind, we ask friends (including those we haven’t met yet) and family for their favourite haunts. Here are what we have so far:

Pubs:

  • Red Lion, Babcary
  • The Masons Arms, Odcombe
  • The Talbot Inn, Mells
  • The Queen’s Arms, Corton Denham
  • The Bath Arms – Horningsham
  • The Bradley Hare- Maiden Bradley
  • The Alhampton Inn – Alhampton
  • The Kings Arms – Charlton Horethorne
  • The White Hart – Somerton
  • The Beckford Arms – Fonthill Gifford
  • The Grosvenor Arms – Hindon
  • The Lord Poulett Arms – Hinton St George
  • The Bell and Crown – Zeals
  • The Stapleton Arms – Buckhorn Weston

Restaurants:

  • @the chapel – Bruton
  • The Pharmacy – Bruton
  • Osip. – Bruton
  • Holm. – South Petherton
  • 28 Market Place – Somerton
  • Todays Menu – Ilminster
  • Clockspire – Milborne Port
  • The Hive – Burton Bradstock
  • The Plume- Sherborne
  • The Newt


If you would like to add to this list (and we hope you do) please either follow us on Facebook or Instagram, links to both are: https://www.facebook.com/GPWestonproperty and  https://www.instagram.com/gpwestonproperty/ 

Is your home bigger than 1,065 sq ft?

Homeowners – Do you know how big your home is?

Don’t worry, most of us don’t – yet it could be fundamental as Somerset and Dorset home buyers search for new homes.

Us Brits are obsessed with our homes, yet most homeowners need to learn the square footage (those born after the mid-1970s) or square metre(age) of their homes.

As an agent, I find homebuyers usually assess the size of their intended house purchase chiefly by the number of bedrooms the property offers. However, could we all make more effort to calculate how much actual space we require in the home outside the number of bedrooms?

Let me see how the properties locally are split down regarding bedrooms.

The split of bedrooms in Dorset is as follows:

  • 8.8% of properties have one bedroom compared to the national average of 10.7%
  • 27.1% of properties have two bedrooms compared to the national average of 26.7%
  • 40.2% of properties have three bedrooms compared to the national average of 40.6%
  • 24.0% of properties have four or more bedrooms compared to the national average of 22.0%

As one would expect for our location in the UK, we have a higher number of 2 and 3-bedroom homes in our locality.

So, are more bedrooms better? Not necessarily.

Unless you are buying a property to develop and then sell on straightaway, I believe it is imperative to enjoy your property for what it was designed to be – your home.

Though room for growth and resale ability potential of the house purchase is vital, the manner of the way you and your family live and how you use your home must be the primary consideration for improving your quality of life. And because of this …

I have noticed a slight change in how Westcountry buyers (and tenants) have been asking and enquiring about property in the last 18 months.

The first is asking for a property’s energy efficiency rating. This can be seen on the property’s Energy Performance Certificate (EPC). That was expected, with the rise in gas and electric bills.

Yet the second is that more and more tenants and buyers are asking about the size of the property, which can be found in the EPC mentioned above.

Talk in the property industry suggests a move towards home movers wanting homes with minimum square footage instead of a property with a particular number of bedrooms.

I am noticing mature homeowners in the countryside who are downsizing are asking for the size of a property, as they require fewer yet large rooms.

Should we all consider how we use the space in our homes before we decide to move? Before we do, let’s look at the average sizes of the properties locally.

These are the averages for the Dorset area.

  • The average size of a house is 1,173 sq. ft. compared to the national average of 1,103 sq. ft.
  • The average size of a bungalow is 990 sq. ft. compared to the national average of 862 sq. ft.
  • The average size of a flat/apartment is 452 sq. ft. compared to the national average of 464 sq. ft.
  • The average size of a maisonette is 689 sq. ft compared to the national average of 657 sq. ft.
  • The overall average is 1,065 sq. ft. compared to the national average of 994 sq. ft.

Again, as I would expect due to our location, the average home is larger than the national average.

In the last few years, with lockdowns, as a nation, we have started to use our homes differently.

Rooms in our homes have become interchangeable – having more bedrooms isn’t automatically the status symbol it once probably was.

Spare bedrooms have become offices, dining rooms have become gyms, and so on.

Are you willing to sacrifice living room space for an extra bedroom, even if it makes the living room feel cramped and uncomfortable?

Before selecting a home based solely on the number of bedrooms it offers, there are several factors to consider.

Evaluate your current living space and how you use it.

Determine if you utilise all the rooms to the best of the space available, if you have enough storage, and if the layout works for you. If you value space and openness, prioritise square footage instead of bedrooms.

Consider your current life stage and living space needs. If you have a family, bedrooms may be a priority, but assessing how many are needed is essential. It would help if you also considered whether you need a separate space for work or a top-of-the-range ensuite.

If you plan to rent out your property, the number of bedrooms is crucial.

However, it is essential to consider the type of tenant you want to attract and what type of space would be most marketable.

Instead of moving to a new home, renovating your current space might be a better option?

By reconfiguring the space or extending it, you could improve your quality of life or increase the value of your property. A home makeover could give you the open space or environment you desire?

By answering these questions, you can determine whether the number of bedrooms, other rooms, or square footage is the most crucial factor when selecting a new home.

What do you think?

Before I go, if you are a homeowner in the Westcountry or a property buyer and you want to pick my brains on your best options, please don’t hesitate to pick up the phone or drop me a line and we can start a discussion without any obligation or cost.

Cautious Optimism in the Property Market

As the British and Westcountry property market navigates the ongoing economic turmoil, many local homeowners and landlords may feel uncertain about the future.

However, up-to-date data suggests that the 2023 property crash predicted by the many newspapers and the usual clickbait doom-mongers in the lead-up to Christmas on social media, may not be as bad as initially thought, and there are reasons to be cautiously optimistic.

According to property website Rightmove, the average asking price of a home for sale in the UK rose by just £14 in February.

While this might sound like cause for concern, asking prices remaining flat rather than falling could be seen as a positive sign for the year ahead. Remember that they are only what people are asking (and not necessarily achieving).

So, what exactly is happening in the local property market?

Well, it all starts with realistic pricing.

Thankfully, most sellers in Somerset and Dorset are heeding their estate agents’ advice and being more realistic on price, helping maintain market stability.

If you are realistic with pricing, the property should sell.

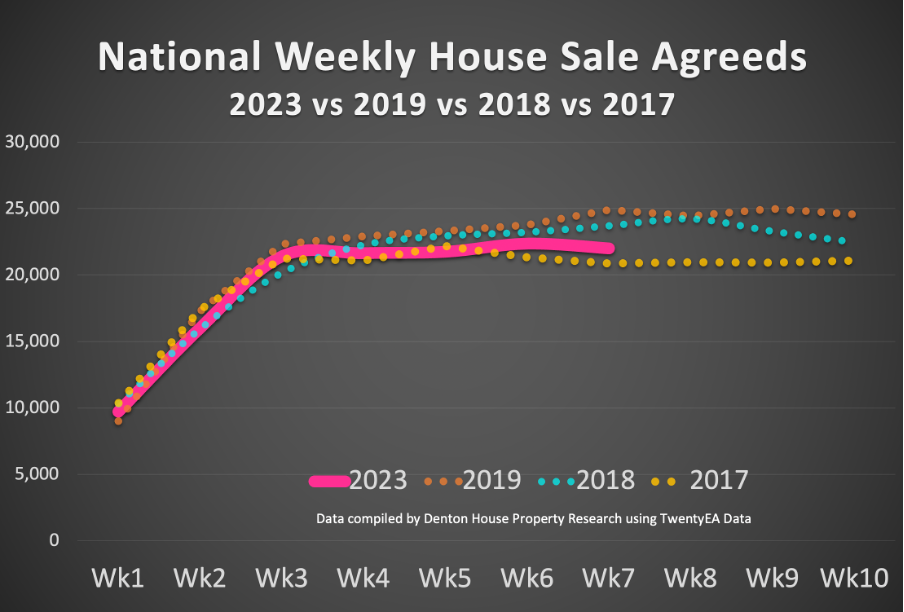
The time it takes to get a property to sale agreed upon has increased nationally from 21 days in the summer of 2022 to around 50 days in Q1 2023.

Additionally, despite the turbulent economic conditions, buyer demand is rising. Rightmove also reported in the national press that the number of people contacting estate agents has increased by 11% in the last two weeks compared to the same period in 2019.

The number of sales agreed upon has also rebounded.

Nationally, from 1st January to the 19th February 2023,
134,886 properties had been sold subject to contract in the UK.

Not a good figure when I compare it with the same year-to-date sale agreed figures from the last couple of years.

2022 – 173,607 properties sold stc

2021 – 193,607 properties sold stc

But the last couple of years have been extraordinary for the UK property market and should be taken with a pinch of salt in some respect. We must compare 2023 with more normal years, like 2017/18/19/20. This tells a different story.

2020 – 151,694 properties sold stc

2019 – 143,504 properties sold stc

2018 – 138,665 properties sold stc

2017 – 134,503 properties sold stc

The picture looks similar when we look closer to home in Dorset.

In Sherborne (DT9), in the first seven weeks up to the 19th February 2022, 71 properties sold subject to contract.

This year, from the exact 1st January to the 19th February timeline, 44 properties have sold stc, which is lower, yet in the same ballpark as 2017, 2018 and 2019.

Yet it is all terrific selling a house (subject to contract); it is still only sold subject to contract, meaning the sale could fall through (as it is not legally binding).

As an agent who likes to delve deeper into statistics, I considered the ‘net property sales’. (Net Property Sales being the gross number of properties sold that week less the sale fall throughs in the same week).

In the three months leading up to the Mini-Budget in September 2022, there was an average of 17,801 ‘net property sales’ per week in the UK. That dropped by 34.7% two months after the Autumn Mini-Budget to an average of 11,624 ‘net property sales’ per week in the UK.

In the last five weeks, that has rebounded to 17,050
‘net property sales’ per week.

And when you consider the average for the same five weeks in 2017/18/19 was 18,330 ‘net property sales’ per week, we are close to what many considered a normal market.

Improving market conditions have been supported by a reduction in average mortgage rates. Homebuyers taking out a five-year fixed-rate mortgage with a 15% deposit can expect a rate of 4.39% (correct at the time of writing with HSBC), down from an average of 6.1% in early October. This reduction in mortgage rates may have contributed to the recent increase in buyer demand.

These positive signs in the market have led some experts to suggest that a ‘softer landing’ for the UK property market than initially expected could be on the horizon.

The combination of sellers being more realistic on price and an improving picture of the number of agreed-upon sales suggests a more positive outlook for the property market.

I advise Sherborne homeowners coming to market in the upcoming spring season to use their agent’s expertise and get the price right the first time to find the right buyer more quickly. If you do wish to chance a higher asking price, only do so for no more than two weeks. If you haven’t sold by then, take the agent’s advice and realign your asking price.

34 Sherborne homeowners have realigned their
asking prices since 1st January 2023.

While it’s true that some first-time buyers may still be priced out of their original plans and may need to look for a cheaper property, save a bigger deposit, or factor higher monthly mortgage repayments into their budgets, there is still cause for optimism.

There is still a considerable demand for buying property in Sherborne – renting is becoming increasingly unattractive for many people as rents are increasing by double digits percentages.

It is important to remember that purchasing a property always involves a trade-off between what one desires and what is affordable, regardless of the market conditions. For example, while a four-bed detached house may be out of reach, a larger and older three-bed semi-detached property may be a more realistic option (and probably have similar square footage).

Sherborne landlords looking to invest in buy-to-let homes – now may be a good time, as rising rents could offer attractive returns.

Of the 37 properties let in Sherborne since the 1st January 2023, the average rent achieved has been £1,076 per month. This is a significant drop in the number of properties let in the same first seven weeks of the years of 2017/18/19 and a massive increase in rents.

Finally, the newspapers will be full of news about house price drops in the coming months. All the indexes report house sales where the sale agreed price was offered nine to eleven months ago and completed (i.e., monies and keys handed over) three or four months ago. This peculiar time lag means the house price data is nearly a year old before publication.

So, if you decide to buy a home on that information, you are using old property data. In late 2021/early 2022, there were 30+ viewings per property, and people paid way over the asking price to secure a property. Now there is more ‘normality’ in the Sherborne housing market; today’s prices are also more normal (at or slightly below the realistic asking price). So yes, the house price indexes will show a reduction in house prices. The newspapers will say house prices are crashing, yet when it is explained I have above … whilst it is not a newspaper clickbait title – it is the truth and it’s more of a return to more ‘normal house prices’.

So, prepare for clickbait newspaper headlines of a house price crash (because ‘bad news sells newspapers’ as the saying goes).

Also, prepare for the doom-mongers to quote the bad news of the earnings-to-house prices ratio at one of its highest levels ever.

Earnings-to-house price ratios are a poor measurement of health in the UK property market. Instead, I believe Nationwide’s measure of first-time buyer mortgage payments as a percentage of take-home pay is better (as it is actual pound notes out of actual pay packets).

The Nationwide measure of first-time buyer mortgage payments as a percentage of take-home pay has grown for first-time buyers from 30.4% in Q4 2021 to 39.4% in Q4 2022 … a massive rise! Yet mortgage interest rates have dropped since then (so that percentage will fall). Also, to give some context, let us not forget that percentage in 1989 was 48.4%.

Ultimately, Sherborne homeowners and landlords should decide, based on their unique circumstances, rather than being swayed by newspaper headlines or general market trends. Anyone uncertain about the property market’s future should contact me for my opinion, advice and guidance.